HOME | ABOUT US | MEDIA KIT | CONTACT US | INQUIRE
HOME | ABOUT US | MEDIA KIT | CONTACT US | INQUIRE
A dive into banking statistics in the Kansas City region offers some insight into why economic growth is as robust as we’d like to see

It’s been said that the First Rule of Banking is to make loans. With corollaries, of course, about both collecting payments on those—and collecting on time.
That being said, it’s worth a look inside the FDIC’s tranches of Big Data to see what’s happened in the local business lending scene since the end of the Great Recession. When you get deep into the weeds, you’ll find some good news, in terms of capital on loan to promote a growing economy, and some information that might not seem quite so encouraging for the regional economy.
An Ingram’s analysis of lending patterns overall, and particularly in the sub-sectors of Commercial & Industrial and Commercial Real Estate, provides some insights on why—even though the nation has technically been in economic-recovery mode since 2009—it hasn’t felt like a recovery for so many businesses.
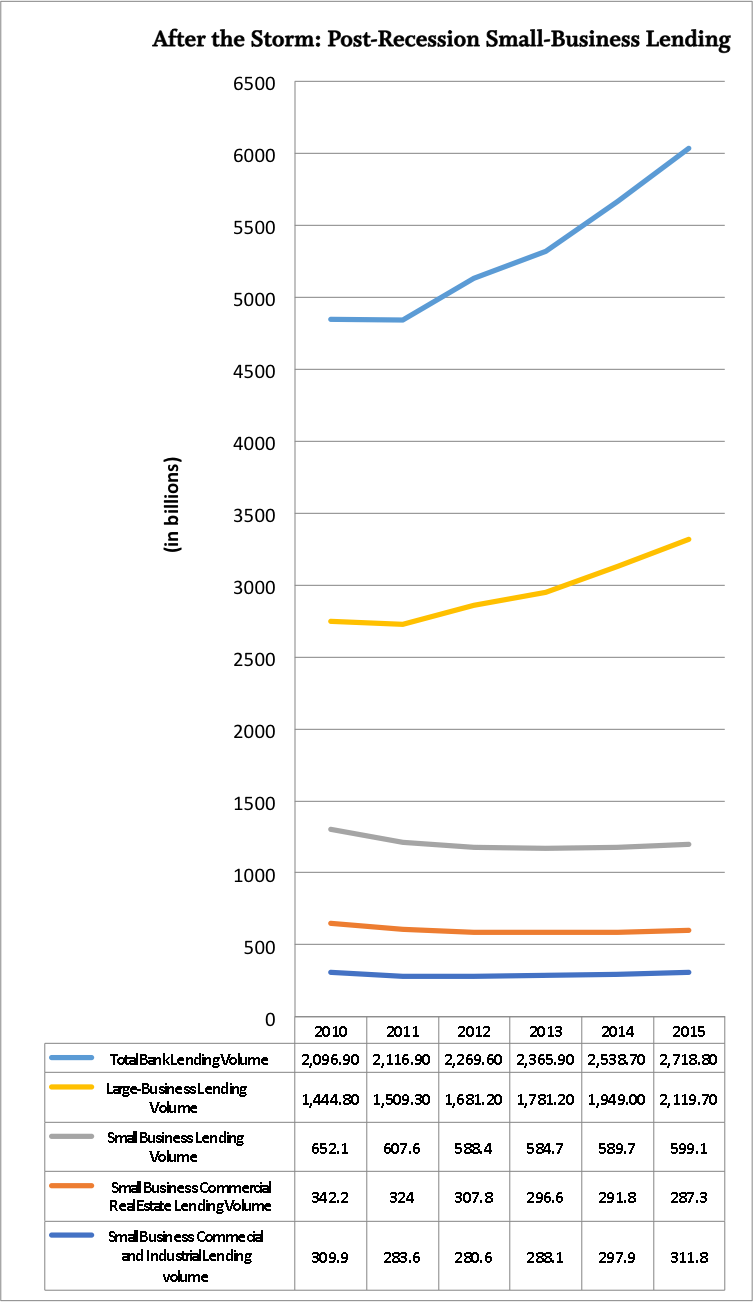
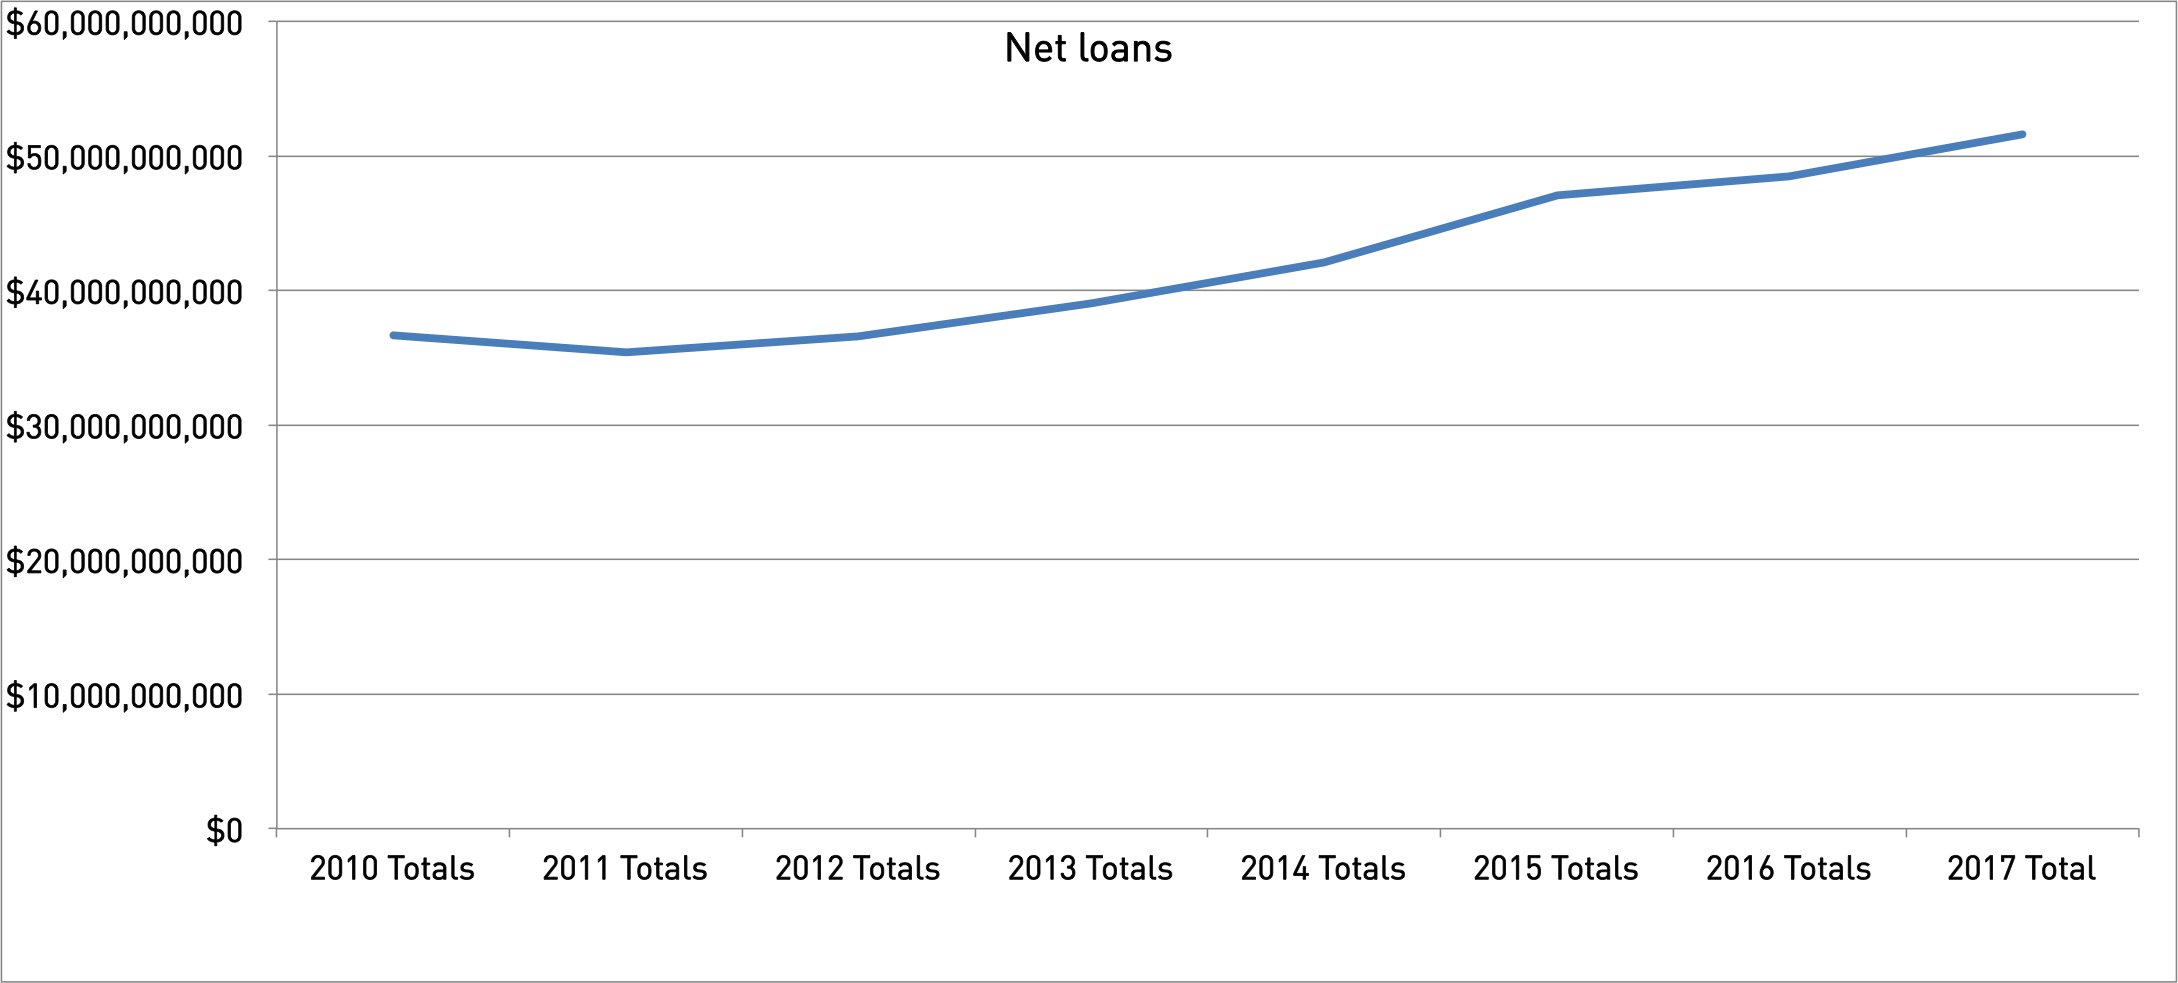
The good news? In the Kansas City, Topeka and St. Joseph Metropolitan Statistical Areas, net loans and leases on the books of banks at the end of 2017 reached $51.6 billion. That’s terrific news for banks, which make their money, after all, by making loans. That figure is more than 40 percent—41.095 percent, to be precise—higher than those banks had on their books at the end of 2010, the first full year after the end of the Great Recession.
But there are lots of ways banks make loans, including mortgage loans, credit-card loans and personal lines of credit. More reflective of how bank capital is flowing directly into business are those C&I and CRE categories. And there, as you get more granular into loan sizes, the overall lending total loses a bit of its luster.
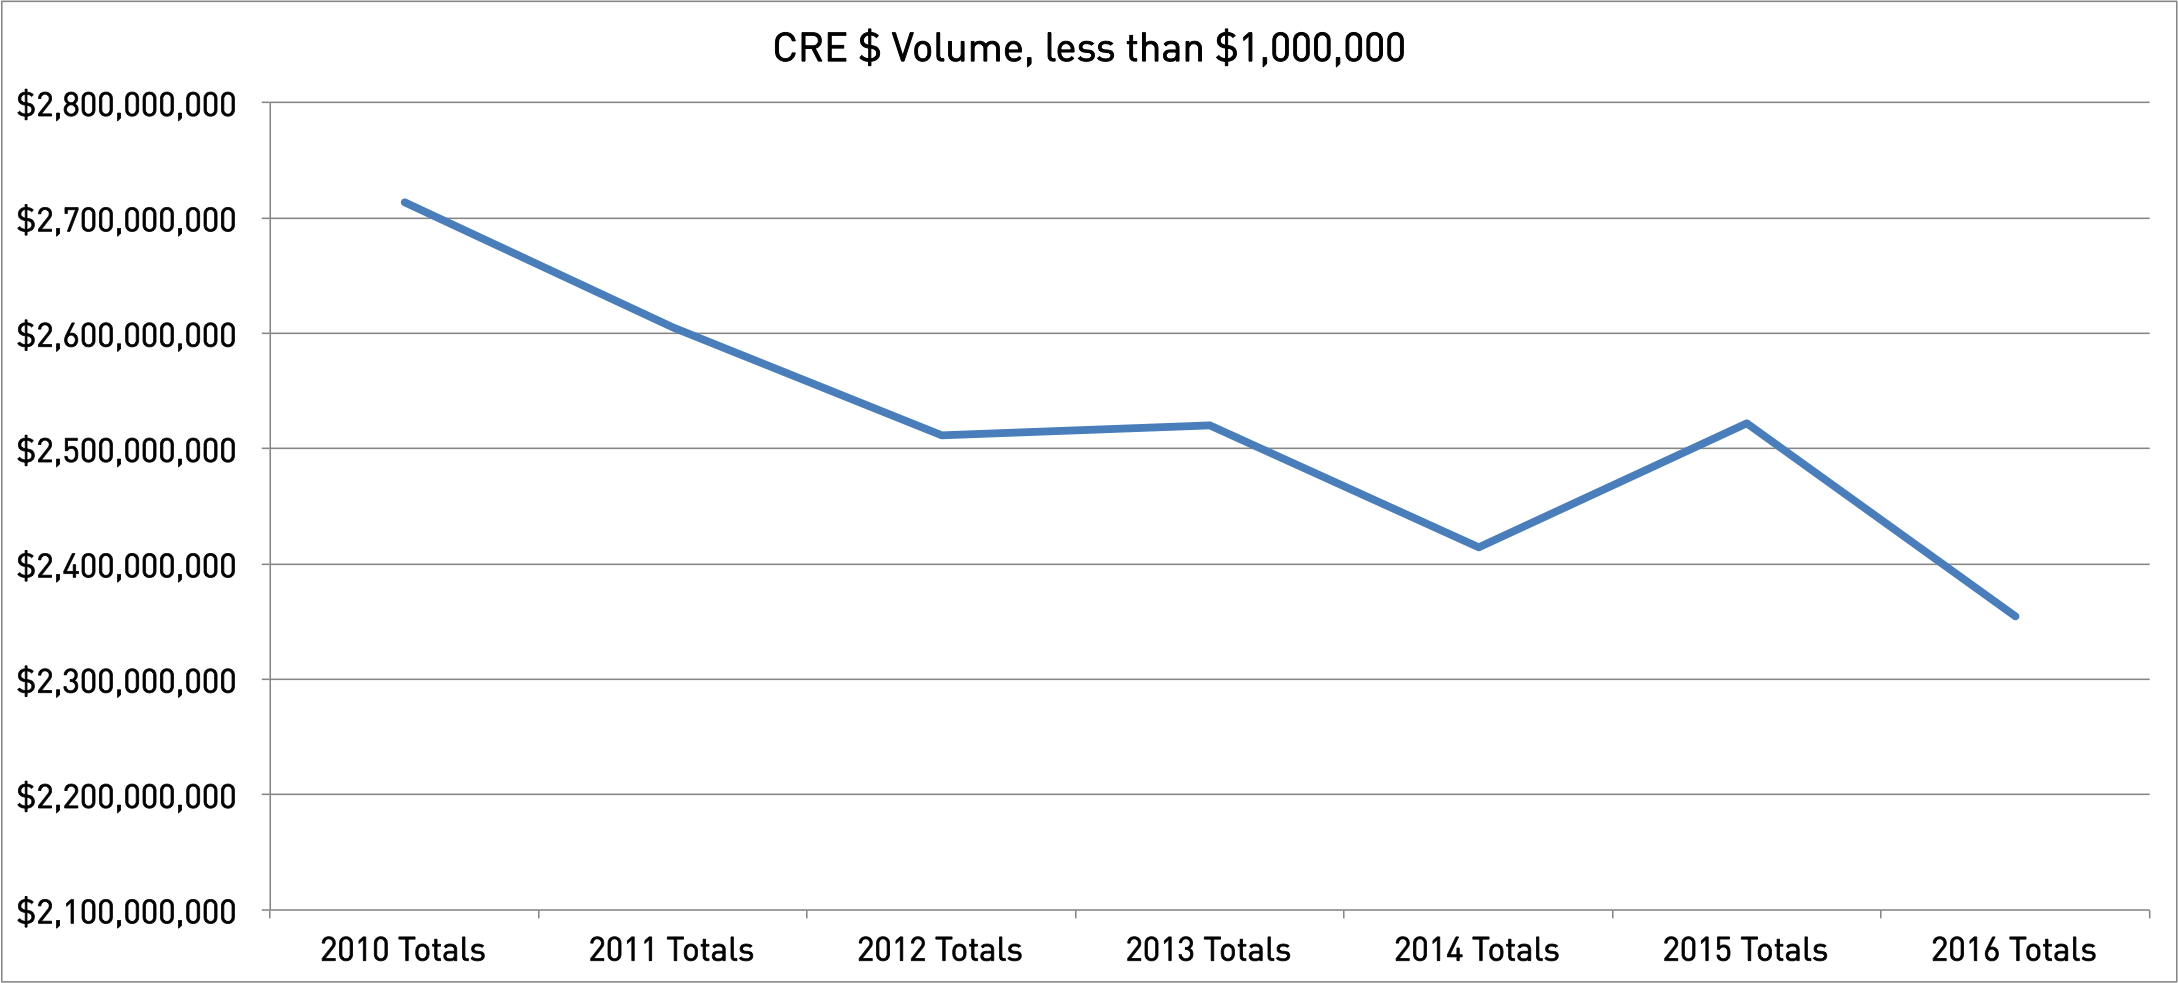
Start with CRE lending. The FDIC tracks what it calls small-business loans across three categories: those of less than $100,000, a range from $100,000-$250,000, and those from $250,000 to $1 million, then aggregates all into a category of loans under $1 million. In each of the three categories in this region, CRE lending actually fell between 2010 and 2016, and it fell disproportionately hard on the smallest segment of borrowers:
Because the latter category accounts for the bulk of transactions classified as small business lending, the overall decline in CRE lending is somewhat muted, at 13.24 percent. But a 13.24 percent reduction in a $2.7 billion combined book of business still means this region saw CRE lending trimmed by $359 million from 2010 to 2016. Accordingly, the number of loans on the books fell from 12,946 to 10,691 over that span.
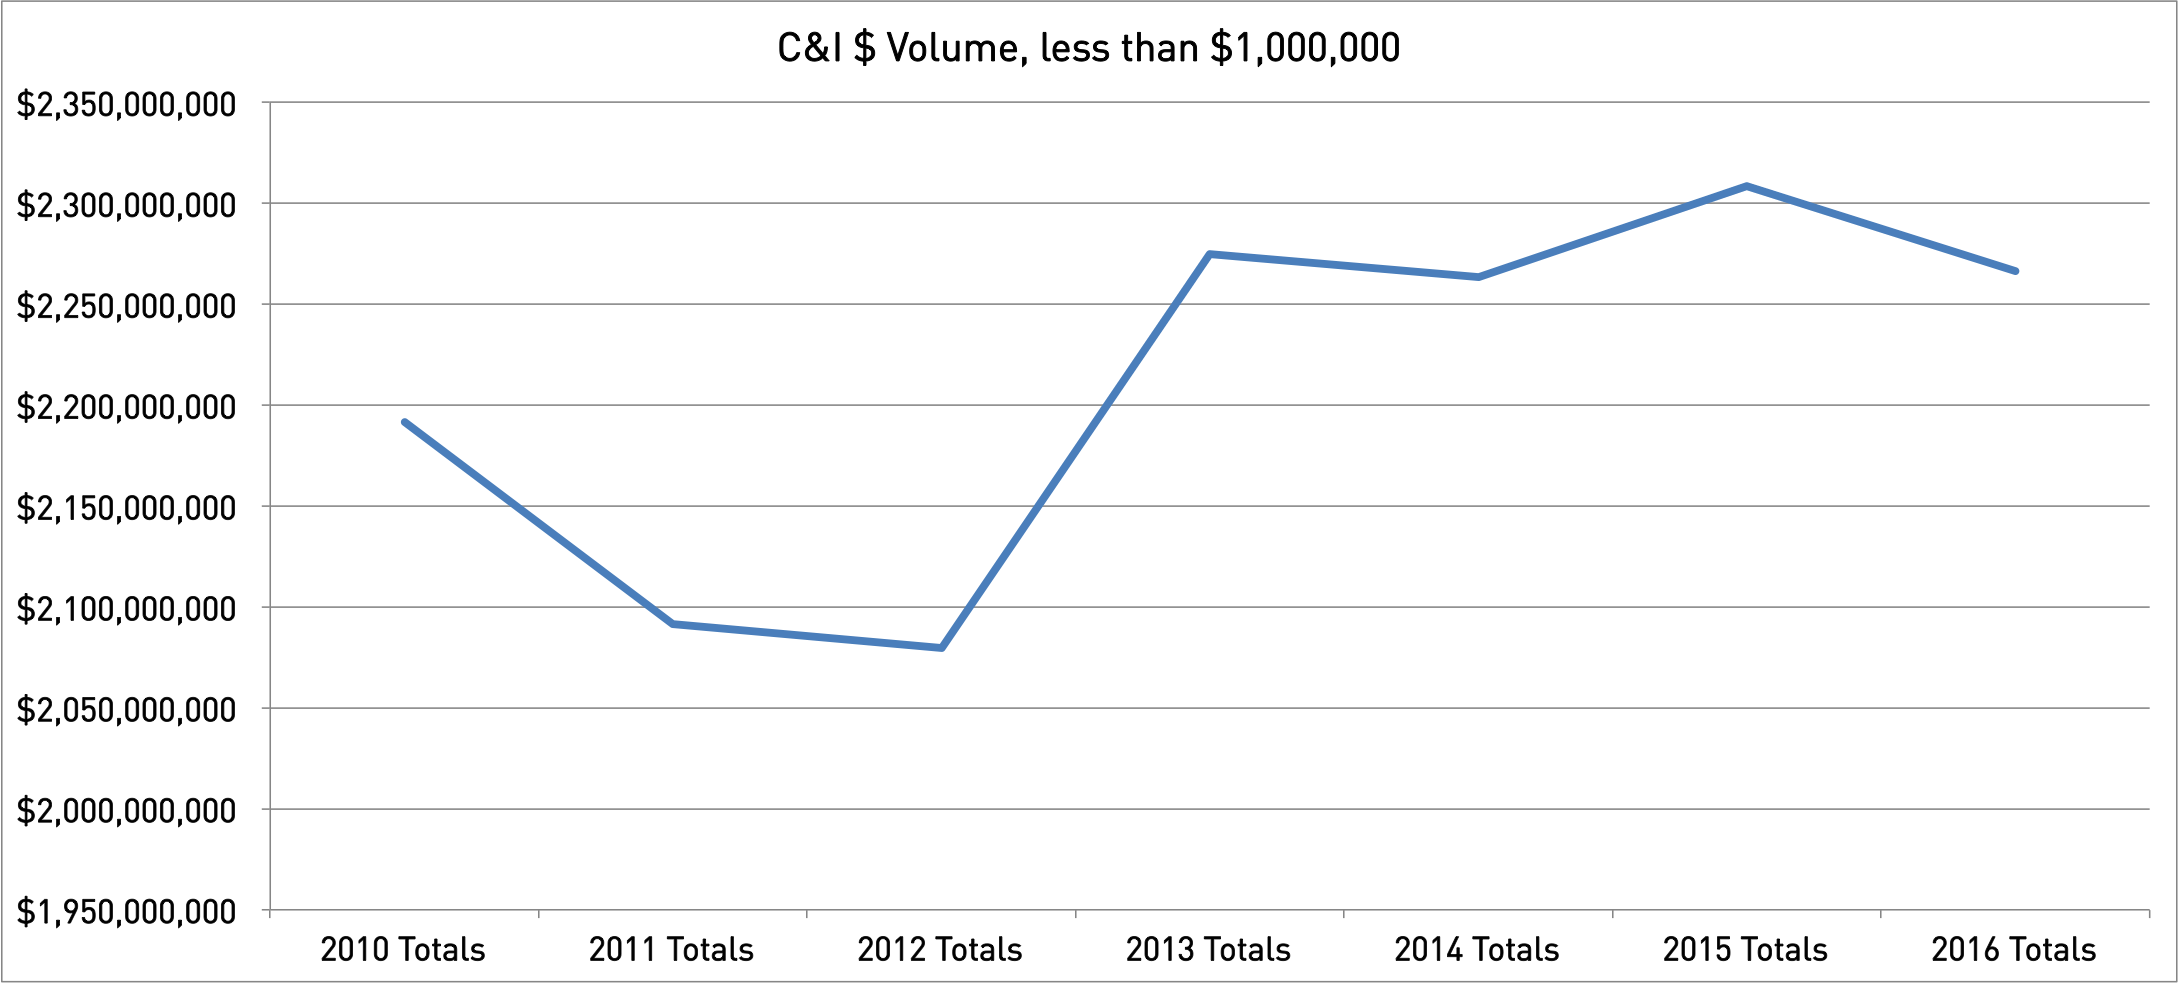

On the C&I side, things weren’t quite as dramatic. Overall, there was a 3.42 percent increase over that period, from $2.19 billion to $2.26 billion—an average increase of less than half of 1 percent in loan volume per year. And, again, the impact was greatest on those with the smallest loans:
Still, the numbers of loans declined in that category, as well: From 45,905 loans under $1 million in 2010, to 38,349 in 2016—a decline of 16.5 percent.
Those trend lines are important, economic-growth experts say, because so much of the new job generation in the U.S. comes from small businesses, especially those just past start-up stage who are beginning to scale.
In Kansas City, according to KC SourceLink, startups now generate an average of 16,376 new jobs annually, and from 2012 to 2016, the total was 84,011. That’s nearly 8 percent of a regional work force of roughly 1 million.
Nationally, figures from that same time are not yet available; the closest ones can be found in the U.S. Small Business Administration’s report on small business lending in the U.S. for 2014-15. Smaller businesses, moreover, are more dependent on access to credit, and for most of them, the banking system is their best option for meeting their credit needs.
One of the factors that contributed to the depth and duration of the recession and the lack of energy in its recovery—and continues to do so today—is that large corporations, which have less need to seek capital from the banking system, are sitting on considerable amounts of cash.
In the face of a tightening credit market for smaller business, the SBA study cites anecdotal evidence that small companies are turning to alternative sources of capital, including on-line lending sites and trade credit, to secure vital operating cash. And lending in that space is inherently more costly to borrowers because of interest rates that are generally well above those of traditional banks.
Somewhat incongruously, the declines in key lending patterns have come as interest rates set by the Federal Reserve have risen, giving bankers greater incentive to make more loans.
What’s happening in Kansas City, the SBA figures show, is not reflective of the broader national market. While marketplace lenders are gaining shares in the small business credit market. “The pace of small business borrowing and lending has stabilized, and continues to improve when looking at the value of loans,” the agency said, pointing to the greatest improvements in loans under $100,000.
But like the Kansas City market, the numbers of loans overall declined, driving the average loan size up.
Nationwide, loans of less than $1 million for C&I and CRE rose by $14.4 billion from 2013 to 2015. That covered 22.3 million loans on the books, and is significant, because 92 percent of the small business loans that are made in this country fall into that sub-$100,000 category.
The upside for businesses looking to borrow, the SBA says, is that they are more likely to find what they’re looking for from community banks. That, however, is a relative standard: Washington considers community banks to be those with assets of under $10 billion, and in the KC market, only two locally based banks meet that threshold—Commerce and UMB.
And nationwide, the larger the lender, the smaller the percentage of small business loans in the bank’s loan portfolio, the SBA report says. Institutions with less than $1 billion in assets accounted for 27.8 percent of all small business loans outstanding, a figure that grew relative to middle-market banks ($1 billion to $10 billion in assets) and large lenders above that threshold.