HOME | ABOUT US | MEDIA KIT | CONTACT US | INQUIRE
HOME | ABOUT US | MEDIA KIT | CONTACT US | INQUIRE
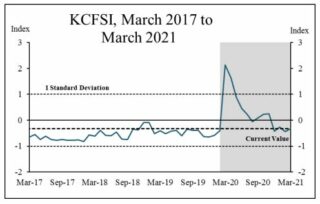
Data from the Kansas City Financial Stress Index (KCFSI) shows the index edged up from -0.46 in February to -0.33 in March but remained below its historical average.

Graph courtesy of the Federal Reserve Bank of Kansas City
The index is a monthly composite index of 11 variables reflecting stress in the U.S. financial system. These variables fall into two broad categories–average yield spreads, and measures based on the actual or expected behavior of asset prices. The index is calculated using the principal components procedure.
The behavior of yield spreads subtracted 0.01 from the KCFSI in March. The behavior of asset prices, particularly the increase in the idiosyncratic volatility of bank stock prices, added 0.12 to the KCFSI in March.
A positive value indicates that financial stress is above the long-run average, while a negative value signifies that financial stress is below the long-run average. Another useful way to assess the current level of financial stress is to compare the index to its value during past, widely recognized episodes of financial stress, according to a release on the Federal Reserve Bank of Kansas City’s website.