On Average, Nothing About These Gains Was Average
Fittest Execs and Fittest Companies Challenge again shows that workplace wellness programs, done right, can produce dramatic health gains across large populations.
Fittest Team Fittest Individuals Most Improved Teams Most Improved Individuals

Through four years, no two Fittest Execs and Fittest Company Challenges have been entirely alike when it comes to the fields of contestants. Given the shifts in balances between men and women, those under 50 and those past that milestone, and those who enter in near-peak fitness levels compared to those urgently seeking strategies to regain control of their own health and wellness, field-wide comparisons can be problematic.
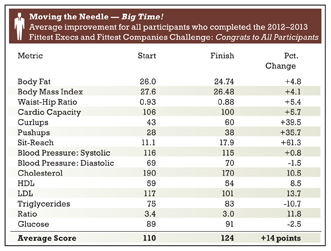
But here’s one statistic you can’t dispute: The recently concluded 2012–13 installment produced the highest overall level of health improvement in the four years of the competition: Nearly 83 percent of those who finished the recent Challenge with higher scores than they had going in—many participants enjoyed extraordinary results. And nearly all of them did it in impressive fashion: On the 150-point scoring matrix—with scores of 1 to 10 assigned for each health measurement—contestants on average came away with scores 14 points higher than they had when the Challenge started.
That’s within hailing distance of the 20-point threshold that area physicians say would qualify as an impressive achievement for an individual, let alone for a diverse field of hundreds of participants of all adult ages.
In some years, you can see the effects of broader dietary changes in the contestant field, as blood-lipid levels decrease dramatically. This year’s group, however, was dominated by gym rats. By far, the biggest scoring improvements came in the areas of strength and flexibility measurements. Flexibility, which takes on increasing importance as we age (given the role in plays in maintaining balance), saw the full field improve, on average, by more than 63 percent in its sit-reach hip flexion testing, going from an initial reach of just over 11 inches to slightly less than 19.
Core body strength, as well, improved impressively, with average gains of 35.7 percent in the number of pushups performed at final testing, and 39.5 percent in the number of curl-ups.
Those impressive fitness numbers were accompanied by some significant field-wide increases in key blood lipids, too. Cholesterol levels fell, on average, 10.5 percent, while levels of the so-called “bad” cholesterol—low-density lipoproteins—fell 13.7 percent. And the ratio of cholesterol to high-density lipoproteins, where levels below 4.5 are considered optimal, decreased by nearly 12 percent, from an average starting level of 3.4 to an even 3.0.
Overall, health indicators increased for the entire field in 12 of the 15 areas measured.

Fittest Execs Challenge All-Time Top 10
2014 Fittest Execs and Fittest Companies Registration Form
Return to Ingram's February 2013